The Custom tab displays the cards and graphs selected by the user.
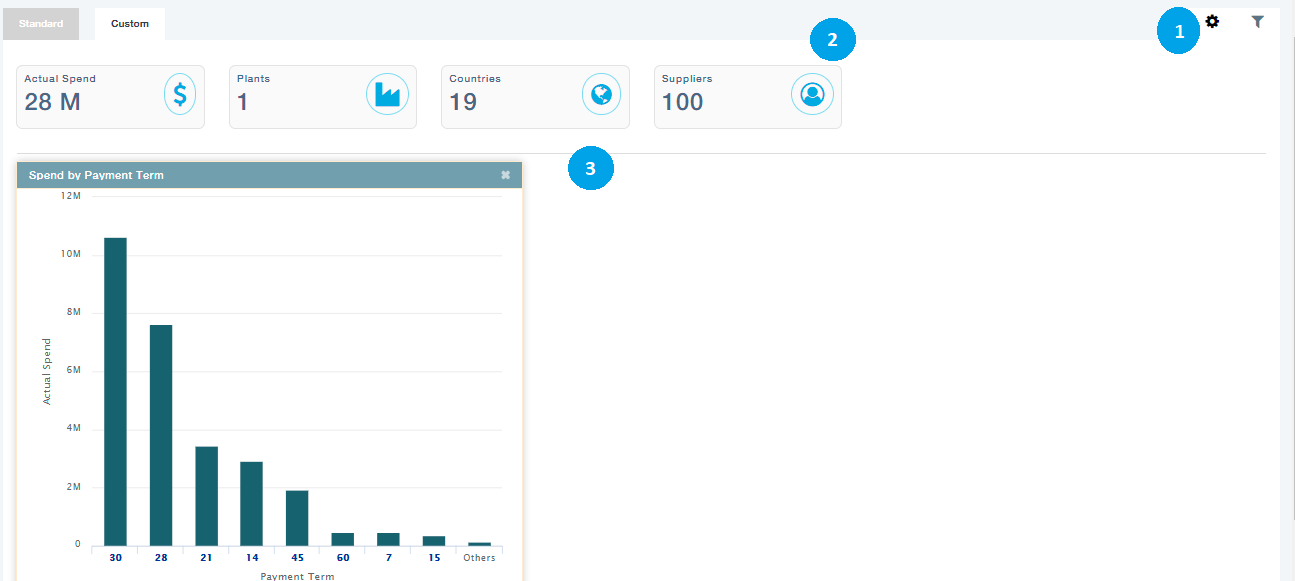
1. The List of Cards and Visualizations are displayed as list as shown.
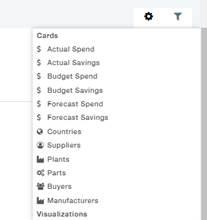
2. Cards Section: The items can be dragged and dropped to the Card section from the list.
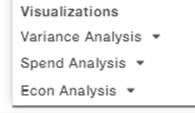
3.Similar to cards, the visualizations can be dragged and dropped into the ara meant for graphs.
The following are the options available under the Visualizations: Variance Analysis, Spend Analysis, and Econ Analysis.