
Menu Path: Category Management >> Category Analytics
Category analysis refers to the process of having an in-depth knowledge of the demand and supply market for a particular category. This not only efficiently helps in managing categories but also matures the understanding of a stakeholder holistically. The Category Analytics sub-menu analyzes data or simply is statistics related to Categories. It is used for the interpretation and communication of data through meaningful patterns such as graphs/charts.
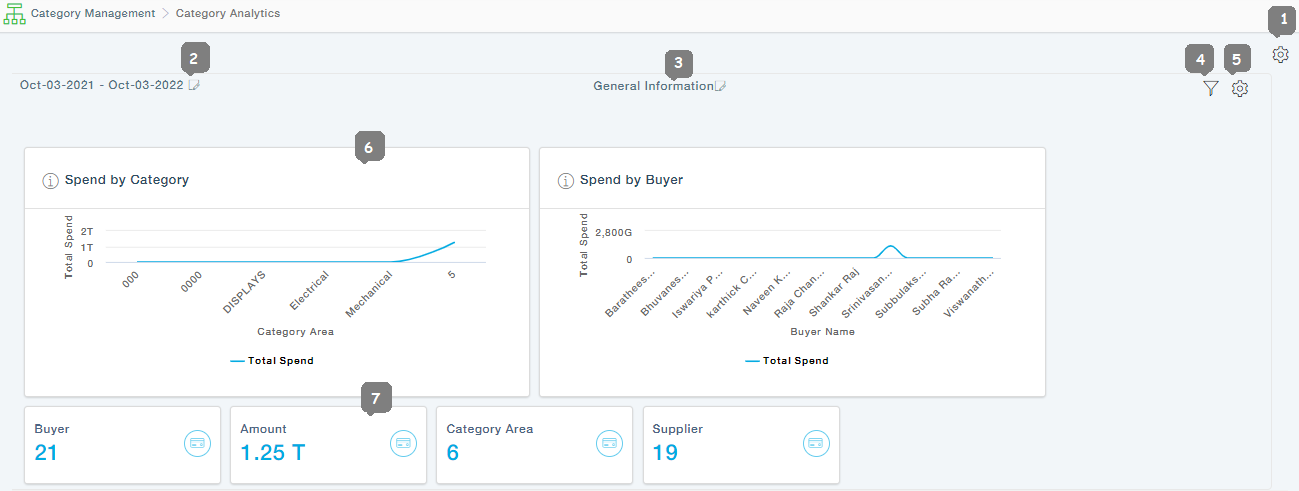
1. Add containers using the settings icon. All the graphs/charts are contained inside a container. The new container is added adjacent to an existing container.
2. Choose the period.
3. Edit and provide a name to the container.
4. Advanced filter helps in searching desired items in charts in the container.
5. Customize Widgets: Choose the required Cards or Charts using the toggle button. You can also Add All widgets or Remove All widgets using the respective buttons at the top. Click Save to save the selection.

6. Sample Chart.
7. Sample Card.